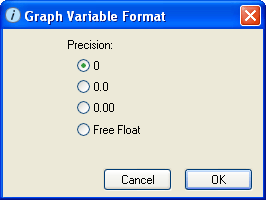
Use the Graph Variable dialog box to specify the precision format for an entity or the unit of time in a graph pad.
Tip: You can also select the precision format for an entity (or the unit of time) by right-clicking the entity's name at the top of the graph (or the unit of time's name below the graph), choosing Precision from the menu that appears, and then choosing the precision format you want.
To open the Graph Variable Format dialog box, double click an entity name at the top of the graph pad or the unit of time (for example, "months" or "days") below the graph.

Select the numerical precision for the selected entity or for the unit of time.
Tips: If the Y-axis for the graph pad appears to have no variability in its range, you need to increase the precision for the selected entity.
When multiple entities in a graph pad page share a common scale, the highest-precision format among the entities will be used for all entities.
The default Y-axis format is 0. Great precision is desirable when you need to view fractional values for entities.
Note: The precision selection you make here for an entity affects the display of the entity in the graph only. It does not change the way the entity is presented elsewhere in the model or the way the entity's value is determined in internal calculation purposes.